dbt observability 101: How to monitor dbt run and test results


Why should you log dbt results? You can now edit this!
Monitoring and logging are essential in every production environment, and your dbt project is no exception. In this post we will share a step-by-step guide on how you can implement a simple monitoring solution for your dbt project, including code examples.
One of the challenges of working with dbt is monitoring the operation itself. Especially on large projects with parallel invocations, it is challenging to understand exactly which models and tests were executed on each invocation and what the results were. Besides monitoring the day-to-day operation, logging results over time can be used for detecting operational problems and opportunities for improving the project, such as:
- Detect performance bottlenecks
- Detect models with deteriorating performance
- Identify flaky tests by tracking dbt test success rates over time
- Find test coverage gaps
- Identify problematic sources
In this great post about his work in Snap, our friend Jonathan Talmi named this perfectly as ‘dbt observability’. Having the infrastructure in place to handle these challenges is the key to scaling your dbt project.
Implementation options and considerations
We had the following considerations when approaching the implementation with an analytics engineering mindset:
- The dbt artifacts and results should be stored in the data warehouse as simple tables.
- Implementation should rely only on dbt functionality.
- Logging the dbt results should be integrated into routine runs.
- Minimal impact on performance.
dbt stores run results and metadata in json files called dbt artifacts. These contain valuable information about two major components we could use for dbt observability solution -
- Metadata about the dbt project — connections between models, tags, owners, connections between tests and models, etc.
- Metadata about dbt command results — execution status, compilation time, run time, error message, etc.
Sounds promising right? Unfortunately, it’s not that simple.
The problem with these files is that it’s relatively hard to process them. To regularly process the artifact files, you need to implement and orchestrate a separate process that runs after every dbt command, and give it access to their location.
Other than that, they contain nested objects (a dictionary inside a dictionary inside a dictionary..), they are not well documented at the moment unfortunately and you need to keep up with their different versions.
Luckily, dbt exposes most of the important information of these artifacts also as Jinja variables.
- Metadata about project resources can be extracted from the dbt graph.
- Metadata about command results can be extracted from the results variable (only accessible during an on-run-end hook).
These Jinja variables can be accessed and used in a regular dbt macro.
We can meet all our criteria above by using Jinja variables! Now let’s get our hands dirty and see how it can be implemented.
dbt observability Implementation guide
The purpose of this section is to provide a simple step-by-step guide for implementing dbt monitoring that is stored in your data warehouse. To do that, we are going to cover the following steps:
- Identify the metadata that should be collected about your dbt results.
- Create a table that will be used for storing the results. We will demonstrate below how this can be done as part of your dbt project.
- Implement a dbt macro that will parse the dbt results.
- Create an on-run-end hook that will upload the parsed dbt results to the table.
(The code below was tested only on Snowflake, but as it is implemented with Jinja it should work on other platforms with minor adjustments. The code in the Elementary dbt package was tested on Snowflake, Bigquery, Redshift and Databricks. There is also a package by Brooklyn data that you can consider for handling the dbt artfiacts).
Step 1 — Identify the metadata that should be collected
We can see a reference to the dbt result object fields in the dbt docs, but we found it easier to just print the result object and identify which fields are needed.
Here is an example of a result object as plain dictionary.
When looking at the example, you can notice the result object has the following structure -
Internally dbt represents the dbt project as a graph, and each node contains metadata about a resource in the project. The nodes are the models, tests, sources, seeds, snapshots, exposures, and analyses in your project. The run result fields contain metadata about the result itself. If you invoke a ‘dbt run’ command and it runs 10 models you will get 10 result objects.
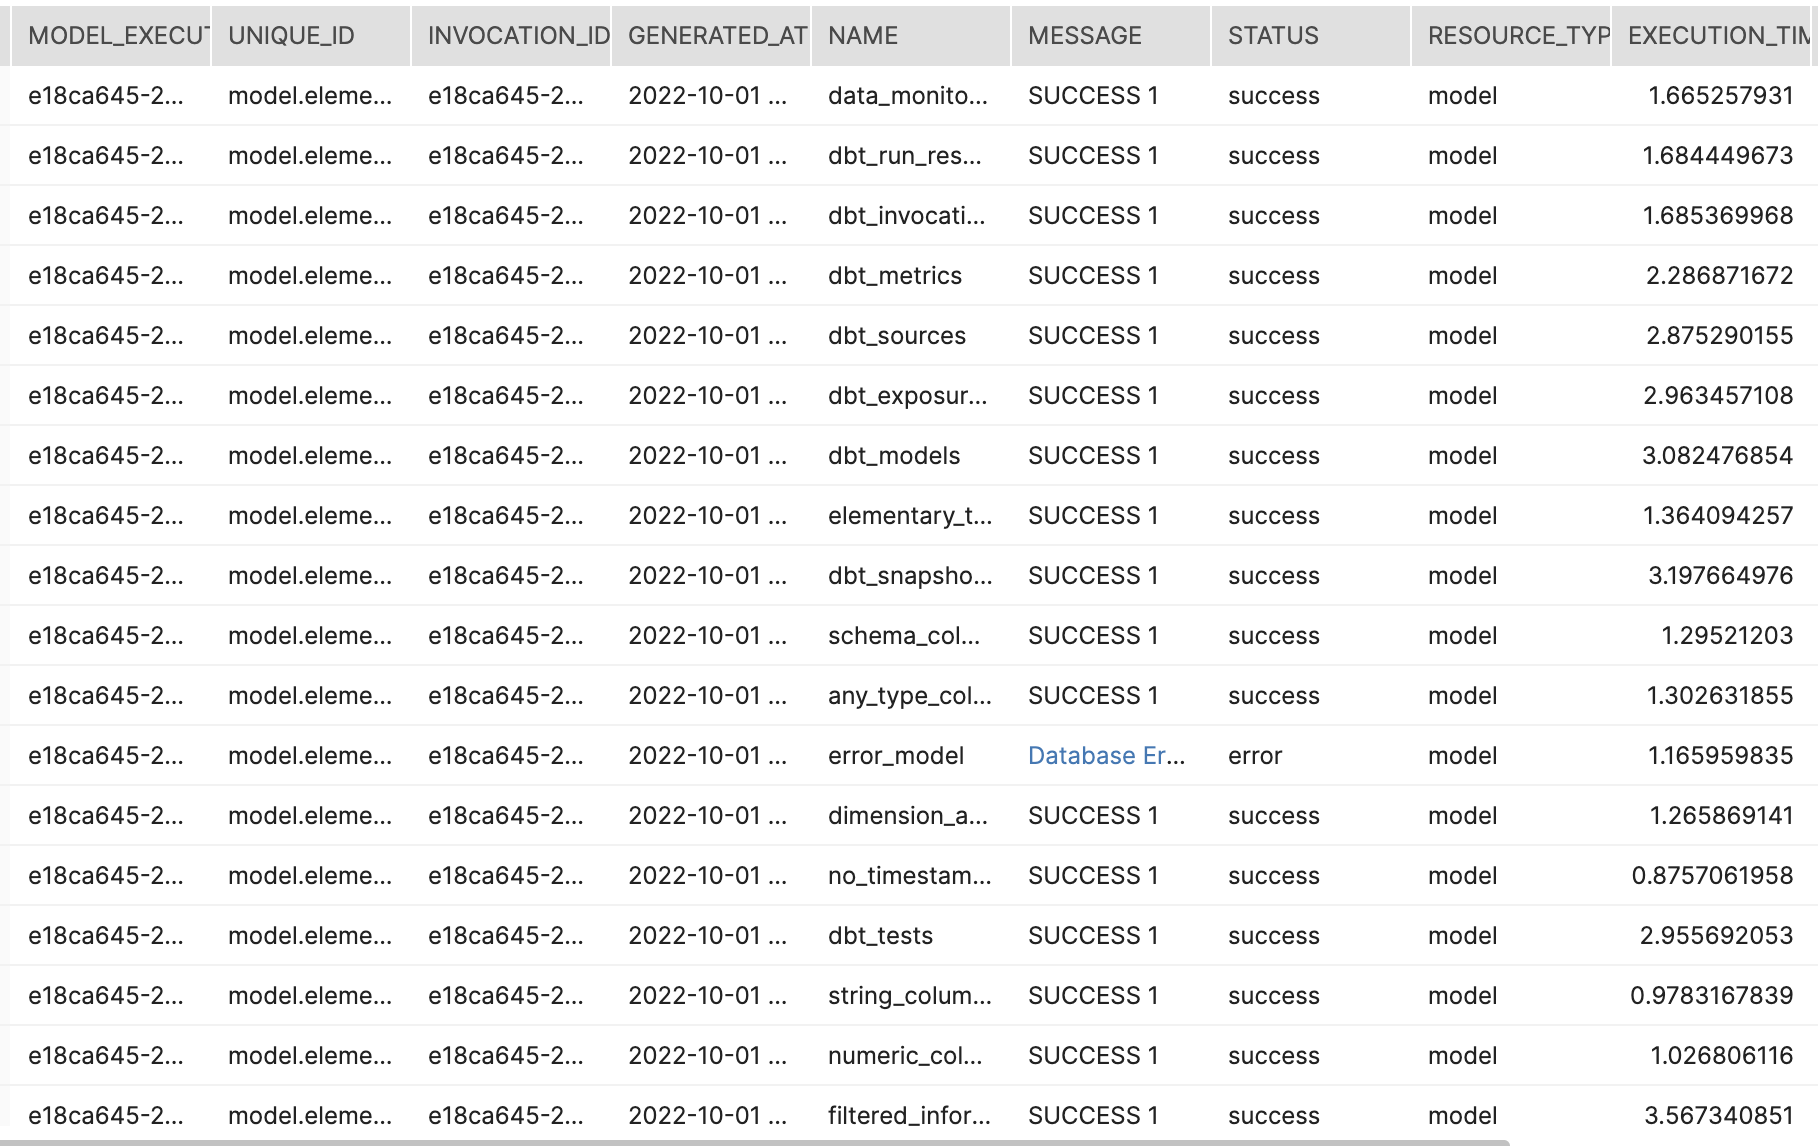
Looking at this run result example, the following fields could be a good start -
Run result fields -
- Status
- Execution time
- Rows affected
dbt graph node fields -
- unique id
- database
- schema
- name
- resource type
To upload these results to an incremental table we will also need to have a unique identifier for each result object. Unfortunately, currently there is no built-in unique id inside a result object. In order to handle this, we created a result_id by concatenating the invocation_id (the same for all nodes in an invocation) and the node unique_id (different for each node).
Step 2 — Create a table that will be used for storing the results
Building tables is one of the tasks dbt does best. However the results jinja variable is only accessible during an on-run-end hook (makes sense, no results before finishing the execution). It is therefore necessary to create an empty table and fill it with data only at the end of executions, during the on-run-end hook.
When it comes to creating an empty table with dbt, we basically have the following options -
- Creating a table with a macro and defining it as a source.
- Creating a table with dbt seed using an empty csv.
- Creating a dbt model using an empty select query.
We will focus on the third option as creating an empty table with a model enables leveraging functionalities such as full refresh, schema change strategies, custom schema configuration, and more.
The following code demonstrates a model with an empty select query. This model creates a table with a schema that fits the fields we extracted in the previous section:
Now to create the table simply run the following command:
`dbt run -m dbt_results`
Step 3 - Implement a dbt macro that will parse the run results
As you saw in the example above, the result object contains many fields and some of them are nested. To be able to easily load the data into a simple results table, we need to implement a macro that flattens the result objects and extracts only the selected fields:
Step 4 — Create an on-run-end hook to upload the results
Now that we have a table with the schema we need and the macro to extract relevant fields, it’s time to put it all together. As mentioned above, this macro relies on the results jinja variable that is available only in the context of an on-run-end hook. So we simply need to build a macro that will be called as an on-run-end hook and does the following -
- Get this results variable as an input parameter
- Flatten the results using the macro above
- Insert it to the table we already created
The following code demonstrates how this can be done:
Lastly, we need to make sure this macro is being called as an on-run-end hook. To do that we simply need to add the following to our `dbt_project.yml`:

What’s next?
Now on every dbt command invocation, this macro will be called at the end of the execution and automatically save the parsed results.
After implementing this, we added more valuable fields and models that will store all of your dbt project metadata in simple tables. This means that in addition to the command results we also upload the metadata of all the models, sources, tests, exposures and metrics. Then on every PR when you change a model or a test, you can run a dbt command that will update these tables with the latest metadata.
On top of these artifact tables it is now possible to create dashboards to show flaky tests and execution results, monitor results using slack alerts and much more. All of that is already included in Elementary and takes just a few minutes to install (Snowflake, BigQuery, Redshift and Databricks are supported!).
From version to version, the dbt team keeps exposing more valuable information in the Jinja context, and we will continue to support these additions.
We would love to get feedback on data that you would love to log from your dbt project, and use cases you think you could unlock with it!
Talk to an expert about your specific needs

