dbt-Native Data Observability

For dbt users that want to deliver reliable data products.
Loved by Engineers. Empowers Data Consumers. Delivers Clarity to Stakeholders.

A screenshot of Elementary's dashboard showing two main sections: a dashboard overview with metrics and test results (top), and a detailed test results view (bottom). The dashboard displays circular progress indicators for test results (87 tests), tables health (22 tables), and monitored tables (22). Additional metrics shown include freshness (22 tests), volume (21 tests), and model runs (16 models). The bottom section shows a detailed view of automated volume tests with a graph showing performance trends.
A composite screenshot showing Elementary's interface with two sections: an Incident Management view on the left showing various test failures and alerts, and a Column-level Lineage view on the right detailing the customers table structure. The lineage view highlights the table's 9 columns including last_name, customer_email, signup_date, and customer_id, showing their relationships and dependencies with other tables in the demo database.
A screenshot of Elementary's Data Health dashboard and configuration panel. The main dashboard shows a 67% overall health score (Medium) with 42 total tests. It displays quality dimensions including Completeness (60% with 17 tests across 22 tables), Uniqueness (no data), and Freshness (70%). The right panel shows the configuration interface for data health formulas, where users can set dimension weights (each at 17%) and score thresholds for different quality metrics.
A screenshot of Elementary's catalog interface displaying the schema details of a customers table in a demo database. The interface shows column definitions including customer_id, customer_email, signup_date, and other customer-related fields. At the top are monitoring indicators for Freshness, Volume, Schema changes, dbt tests, and Anomalies. The left side shows a navigation tree of database tables, and the top right includes options for Test results, Model runs, and Lineage.

Trusted by more than 1500 data teams.

3K Community Members

Data Observability that Works.
For Everyone.

Make it Easy for Engineers to Invest in Data Quality

  • Tools and syntax engineers already know.
  • Leverage existing dbt tests, tags, and configurations-
    No duplicate work, no vendor lock-in.
  • Maintain a single source of truth in the code.
“If you already invested in dbt and did the hard work of transforming how your organization thinks about data — Elementary is a no-brainer.”
thrive market logo
Jing Wang, Data Engineering Manager, Thrive Market

Enable Consumers to Collaborate on Data Quality, Without Coding

  • A simple UI for validations, coverage, and triage
  • Data health scores per domain
  • Data discovery using native catalog and lineage
“The UI is another standout feature. It’s clean, intuitive, and
Perfectly balanced for both technical and non-technical users
flock safety logo
Cory Woystasik, Data Architecture & Governance Leader, Flock Safety

Communicate Data Quality for Confident Decision-Making

  • Use the same set of agreed-upon, consistent data to make decisions.
  • Ensure alignment with best practices and governance goals
  • Maximize ROI from your data & analytics investments
“Each stakeholder can open the screen in the morning, get a quick
overview of the data — and feel confident in its quality.”
fiverr logo
Shenhav Lavie, Senior Director of Data Development, Fiverr

Trusted Data Products

Monitor critical assets and ensure all data consumers rely on validated data sets.

AI-Ready Data

Deliver consistent, validated, high-quality data to power successful AI initiatives.

Faster Time to Insights

Minimize debugging and validation time so you can maximize business impact.

Built into dbt, integrates
with your stack

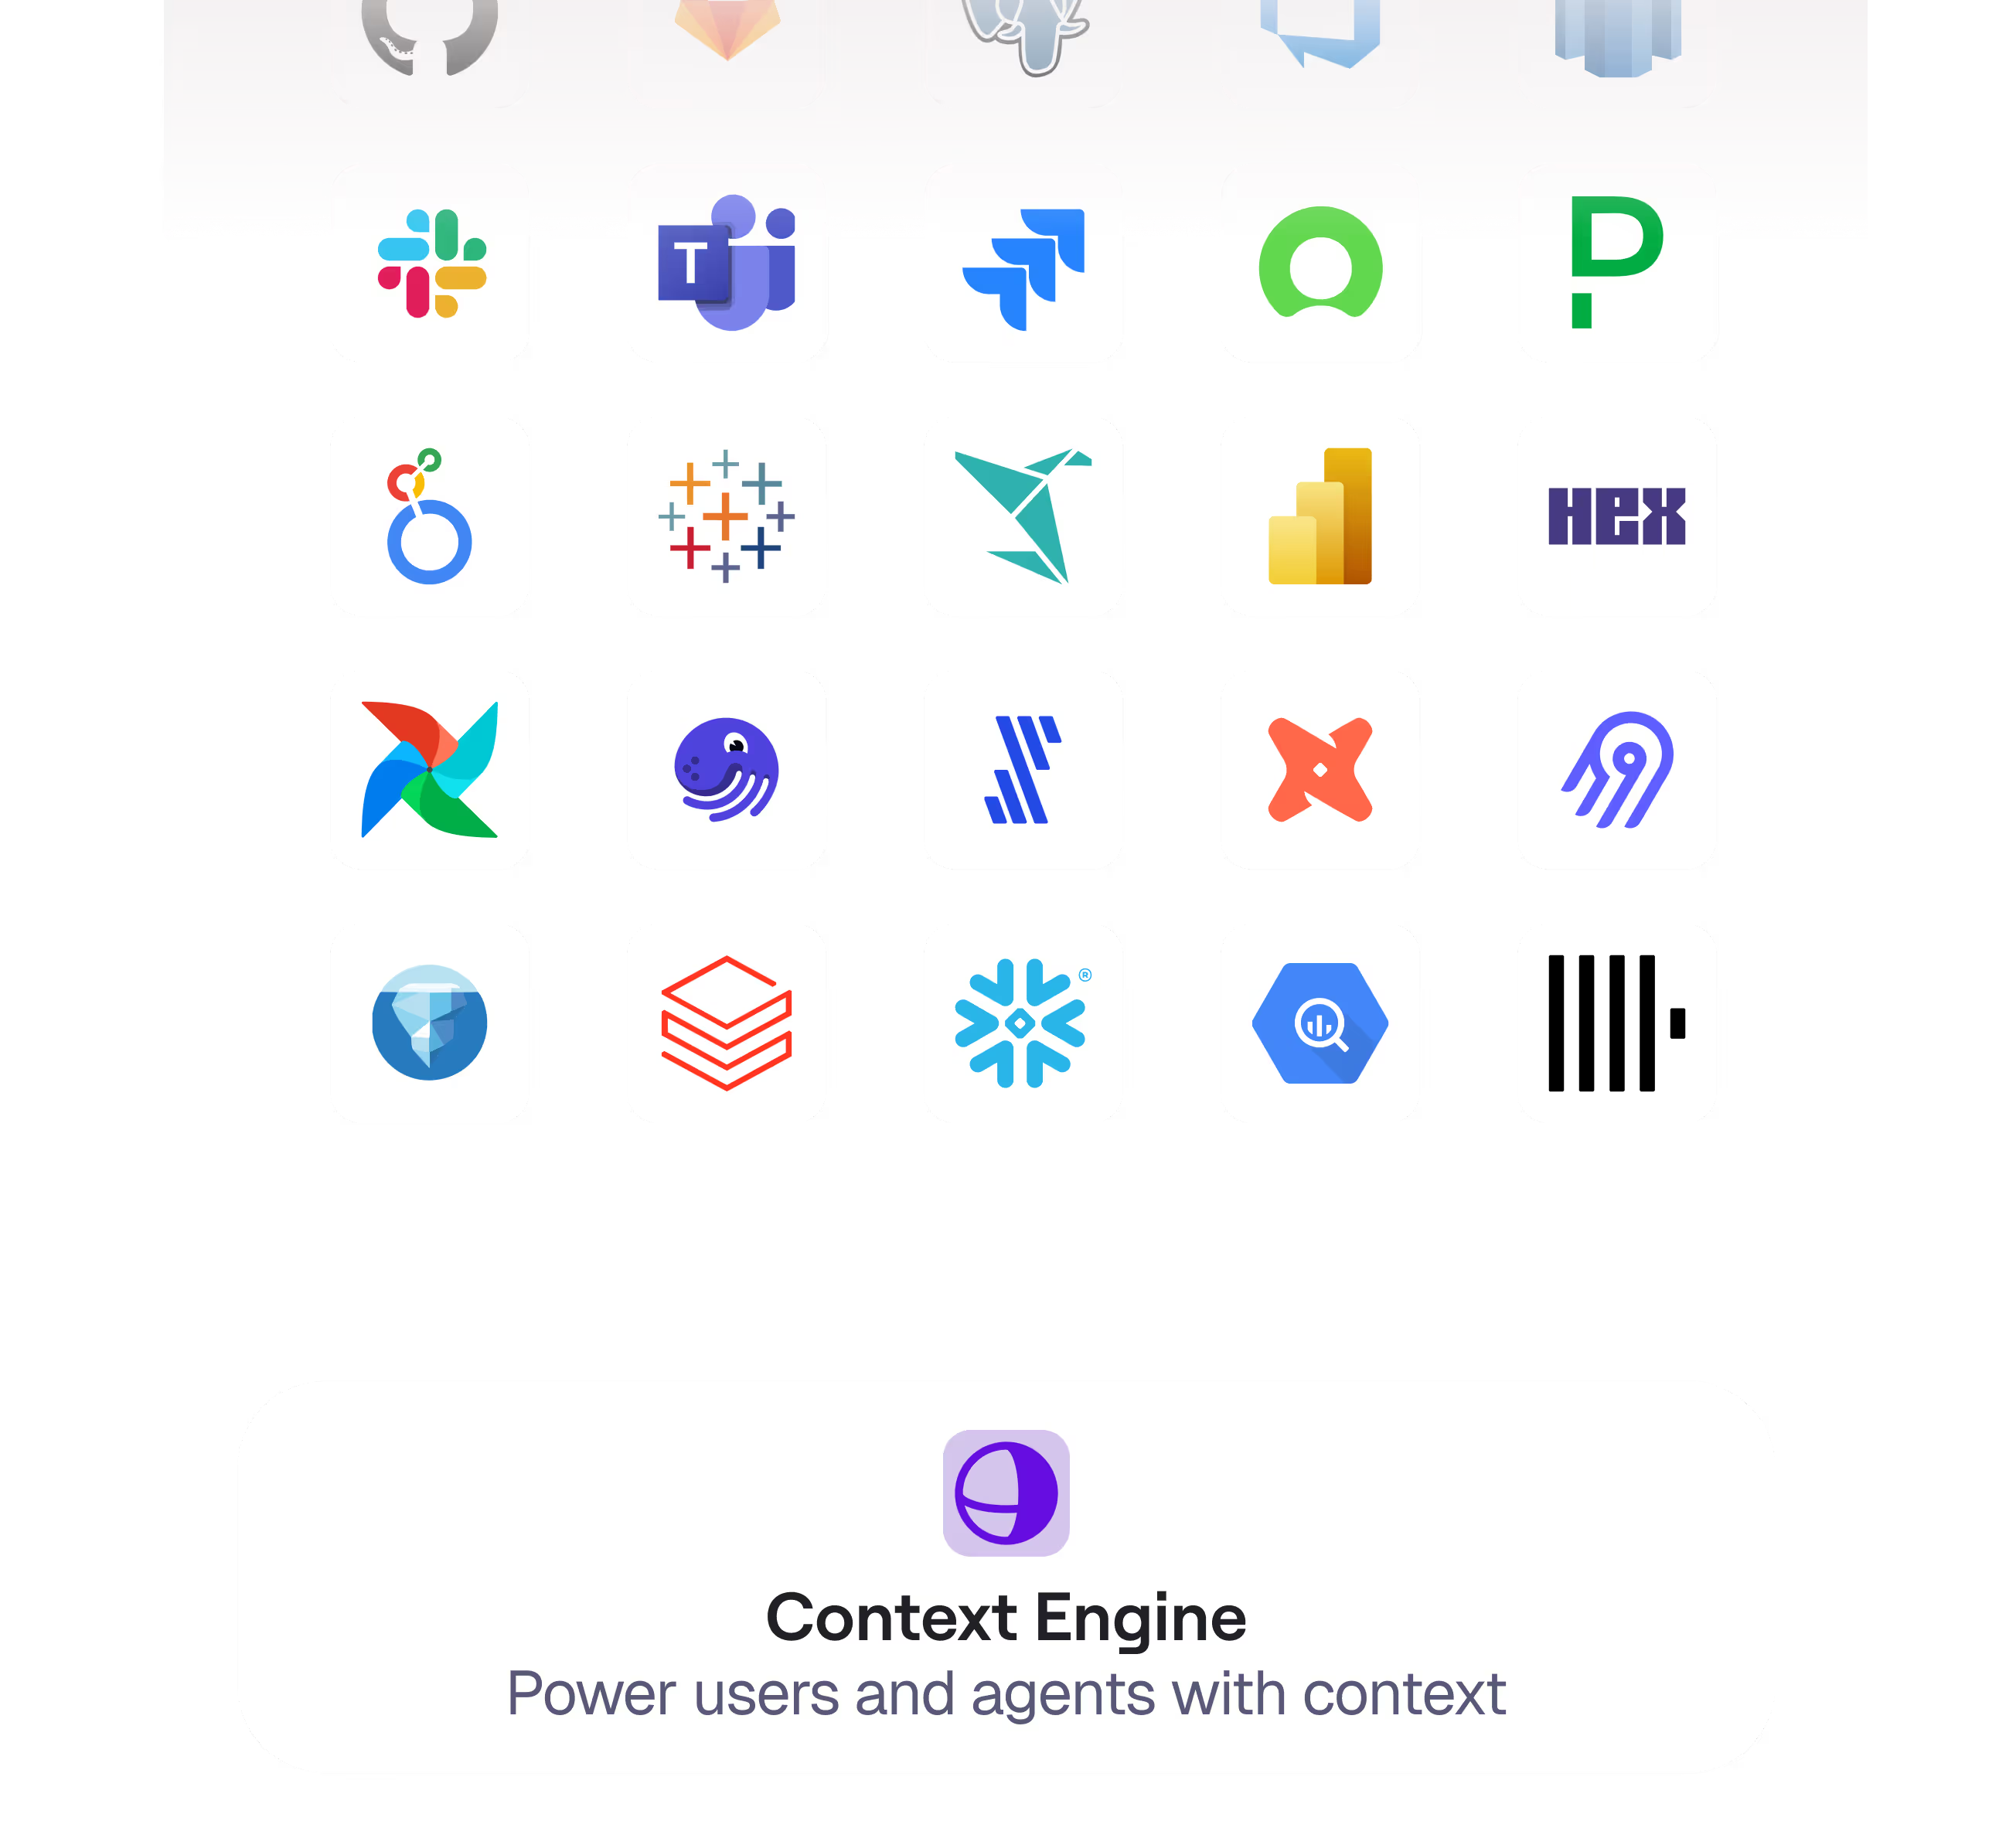
A diagram showing integration connections between tools. At the top is the dbt logo connected to Elementary's logo, with a bidirectional arrow between them. Below are two rows of integration icons: the top row showing data warehouse and source control platforms, and the bottom row displaying various monitoring and collaboration tools.A diagram showing integration connections. At the top are dbt and Elementary logos connected by bidirectional arrows. Below are two boxes with logos: one containing data warehouses and source control service icons, and another with collaboration and monitoring tool icons. These boxes are connected by dotted lines to the main tools above.

Everything you need to deliver reliable data. Easily.

Manage dbt tests, Elementary tests, and custom SQL tests from one place to streamline your data quality workflow.

A screenshot showing a failed test results table in Elementary's data quality monitoring interface. The table displays various tests run on different tables in a demo database. Each row shows details including table name, column name, test name, test type, last test run timestamp, and status. All tests shown have failed (indicated in red), including anomaly detection tests, not_null validations, and schema change checks. The tests were run on January 6th, 2025, across tables such as cpa_and_roas, orders, order_items, and marketing_ads.

ML-powered anomaly detection monitors automatically identify outliers and unexpected patterns in your data.

A screenshot of Elementary's Data Tests Results interface showing automated volume and schema tests for a demo database. The page displays test results for the stg_customer_hr_user table, specifically monitoring the user_id column. Both the schema and volume tests show failure status as of November 24, 2023. The graph below shows volume trends over time, with a relatively stable green line followed by a sharp red spike at the end, indicating an anomalous change in data volume. The interface includes options to view test runs, view in lineage, and copy link.

Automated column-level lineage allows you to understand downstream impact and uncover root cause.

A screenshot of Elementary's data lineage visualization for a demo database. The diagram shows the relationships between different tables, with the customers table (9 columns) at the center. It receives data from four staging tables: stg_customers (3 columns), stg_orders (4 columns), stg_payments (4 columns), and stg_signups (5 columns). The customers table then connects to customer_conversions (3 columns) and a Users table (9 columns). Each table node displays the number of columns and includes colored indicators representing various data quality metrics. The interface includes zoom and filter controls at the top of the view.

Streamline incident management, assign ownership, prioritize issues, notify consumers of impacts, and reduce alert fatigue.

A screenshot of Elementary's Incident Management interface showing a list of data quality incidents in a demo environment. The interface displays various test failures including volume anomalies, null checks, relationships, and schema changes. The incidents are organized with status indicators showing 8 open issues, 28 acknowledged incidents, and 13 resolved cases with an average resolution time of 28 minutes. Each incident row shows the test type, affected table, and timestamp range. The left sidebar contains navigation options for Dashboard, Lineage, Catalog, and other data monitoring features.

Make data quality accessible to everyone by providing health scores by dimension and integrating scores into BI tools and catalogs.

A screenshot of Elementary's Data Health dashboard showing various quality metrics. The overall health score is 68% (Medium), based on 53 total tests. The dashboard displays six key quality dimensions: Completeness (77% with 13 tests across 8 tables), Uniqueness (55% with 6 tests across 5 tables), Freshness (75% with 22 tests across 22 tables), Validity (70% with 7 tests across 5 tables), Accuracy (no active tests), and Consistency (70% with 5 tests across 5 tables). Each dimension includes a trend line showing score changes over time from December 31st to January 6th.

Track failures and runs of jobs, models and test overtime. Fix performance issues that can cause incidents and create unecessary cost.

A screenshot of Elementary's Model Performance interface showing execution metrics for various tables in a demo environment. The interface displays a detailed view of model execution times and statuses, with a time series graph showing performance over time. For the agg_sessions table, it shows a last execution time of 4.9 seconds, with a median of 4.5 seconds and an 8.9% change rate. The graph plots execution times from September 28 to October 4, with most runs taking 4-6 seconds and showing consistent success status. Additional tables listed include marketing_ads, attribution_touches, and staging tables, all showing successful runs with varying execution times and performance trends.

Discover and trust reliable data by exploring assets, viewing dependencies and test results, and accessing SQL queries for transparency.

A screenshot of Elementary's data catalog interface showing details of a customers table in the demo database. The interface displays the table schema with column definitions including customer_id, customer_email, signup_date, number_of_orders, last_name, and customer_lifetime_value. Status indicators at the top show monitoring for Freshness, Volume, Schema changes, dbt tests, and Anomalies. The left sidebar shows a database schema tree structure, and the top right contains options for Test results, Model runs, and Lineage, with an "Add tests" button.

Why Elementary?

Setting the standard for
data observability

dbt-native, code-first

Aligns with your code-first approach and commitment to engineering excellence in data pipelines.

Bridge the gap, create trust

Enable collaboration between technical and non-technical users, ensure transparency with stakeholders, and meet users where they are.

Own your data

The configuration is managed in your code, the metadata is stored in your data warehouse.

Predictable pricing model

A scalable pricing model designed to scale and support optimal coverage.

Community built & loved

Powered by a community of thousands. Join our community to learn and share.

Secure by design

Elementary is SOC 2 compliant, and does not access or process raw data.

“Having benchmarked many other tools in the data observability space, Elementary quickly became my go-to when I changed companies. The tool’s simplicity and effectiveness made it an easy choice”

Manuel Pozo
Staff Data Engineer, Sorare

"Elementary has enabled us to alert analysts who have engaged with our dbt self-serve capabilities of any test failures leading to significantly faster resolution times. Highly recommend!”

Joseph Berni
Analytics Engineer, Gousto

"Elementary was incredibly straightforward, with no major configuration changes needed for our dbt project. After a simple package installation and granting basic read access to the Elementary schema in our warehouse, we were up and running the same day!”

Cory Woytasik
Architecture / Governance Leader, Flock Safety

"One of the things we liked about Elementary was its ability to scale. We didn’t know how many assets we wanted to monitor, and we didn’t want to be limited by a pricing model based on the number of tables monitored.

Artur Yatsenko
Director Data Engineering, Urban Sports Club

Getting started with Elementary is quick, easy, and free.

Step 1

Book a demo

Book a call with an expert to see if Elementary fits your needs.
Step 2

Free POC

You’ll have full access to the platform with support from the Elementary team.
Step 3

Implementation

Our experts will work with you to achieve your goals and ensure a successful implementation.