


Originally posted on the CARTA Tech blog
My name is yanyan, and I am a data engineer at fluct, a subsidiary of CARTA HOLDINGS. At fluct, we are currently focused on building a robust data platform using Snowflake and dbt. In this blog, I’d like to share the measures we have implemented to enhance the observability of our data infrastructure.
tl;dr
- fluct and the data it handles
- Data observability
- Specific measures taken
- Addition of dbt tests
- Introduction of Elementary OSS and Elementary Cloud
- Future outlook
fluct and the data it handles
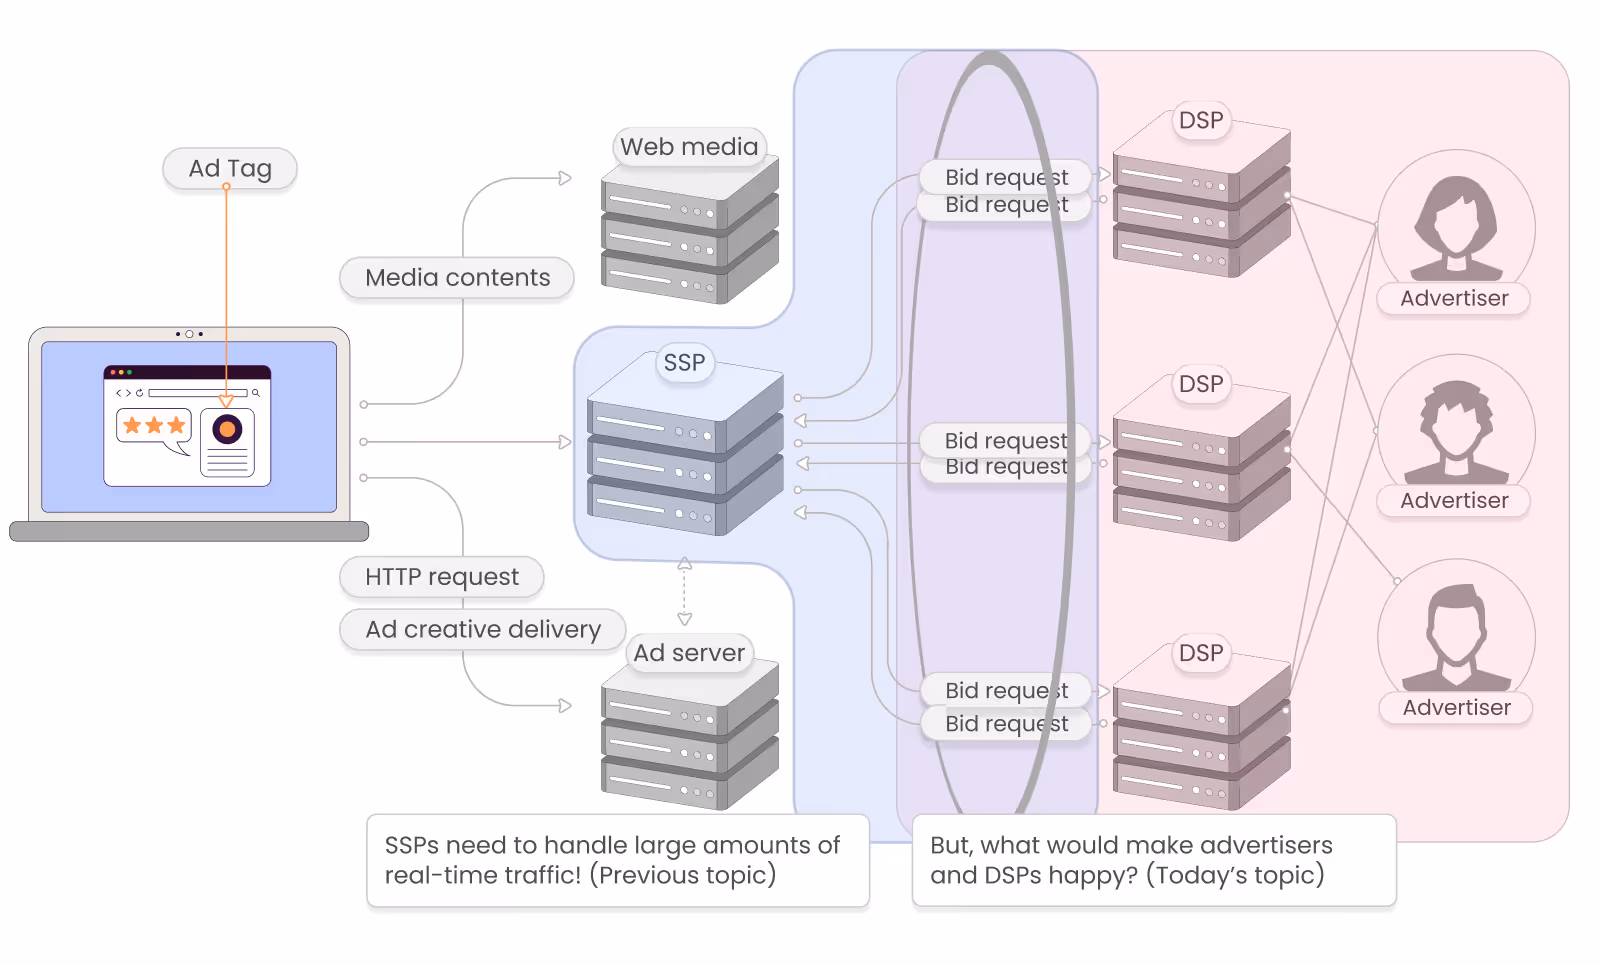
At fluct, we primarily provide services that deliver internet advertisements through our SSP (Supply-Side Platform) business. Consequently, the data we handle is directly related to ad serving. This includes metrics such as the number of ad impressions, clicks, and the cost per impression. Our data acquisition methods are diverse. We use our own servers to measure ad displays and clicks, generating logs from these activities. Additionally, we aggregate report data acquired from other companies to provide a comprehensive view of ad performance.
The main uses of such advertising data include the following:
- Reports on delivery performance for media companies that serve ads and for people within fluct
- Calculation of the amount of money fluct pays to media companies
- Ad Delivery control
- And more
Current fluct data infrastructure
What kind of infrastructure is currently used to handle the data?
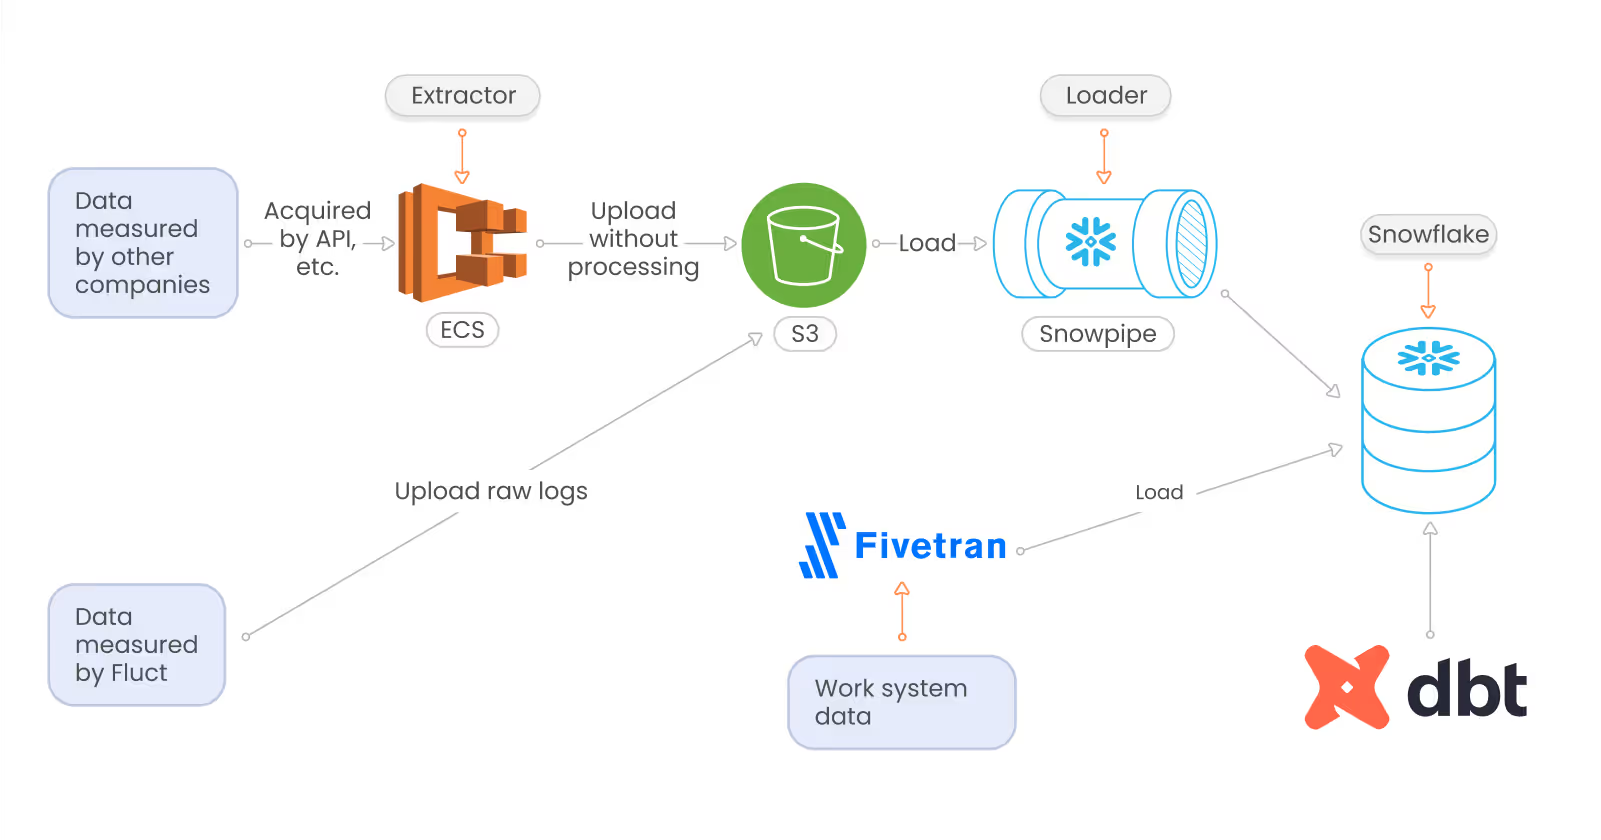
The data pipeline at fluct is based on the following ELT format:
- Extractor
- StepFunctions + ecs (go) to get other companies' reports in batches
- Logs of in-house measurements are uploaded directly to S3 by each measurement platform
- Load
- Snowpipe loads raw data uploaded to S3 by Extractor into snowflake
- Fivetran loads data managed by business system from RDS to snowflake
- Transformer
- Data is processed by SQL using dbt
- Execution infrastructure is dbt Cloud.
Challenges in fluct's data infrastructure
One thing I felt was missing from the current data infrastructure at fluct was a mechanism to quickly detect any data problems that may occur.
While notifications are sent out when the acquisition of data from other companies fails, or when there is an error in dbt execution, there are still some data issues that cannot be detected by these alerts alone.
For example:
- A log is usually loaded every 10 minutes, but it hasn't been loaded for about an hour
- A logic error in dbt processing caused a fan trap, doubling the number of times an ad was displayed
We had no mechanism in place to recognize such problems when they occurred. The only way to notice these issues was to receive an inquiry from a person within the company or a media company who was monitoring the data.
There are two main problems with this situation: the issues are noticed too late, and data engineers might not be able to detect the problem on their own.
First, the later a problem is noticed, the longer it takes to correct it. Data issues require not only fixing the cause but also correcting the erroneous data. The longer it takes to detect the problem, the more data is affected and the more extensive the fixes are.
Second, the longer it takes to recover the data, the more severe the impact. While a few minutes or an hour of data disruption might not cause major issues, prolonged problems lasting several days can damage user trust and decrease sales due to the inability to make data-driven decisions.
Data Observability
To address the issues mentioned above, we decided to introduce the concept of Data Observability, as defined by the CEO of Monte Carlo in the article "What is Data Observability? 5 Key Pillars To Know."
Data Observability provides a mechanism to visualize the state of data and the systems that handle it. With such a mechanism in place, we can quickly identify when data issues arise and determine how to fix them.
What our current data infrastructure at fluct lacks is precisely Data Observability. By enhancing Data Observability, we believe we can create an environment where data engineers can quickly detect problems, reduce the time required to resolve them, and prevent users from losing trust in our data.
5 pillars
In the aforementioned article, Data Observability introduced five specific pillars of what to observe in order to bring about a certain state.
- Freshness: the freshness of the data
- How up-to-date is the data in the table?
- Is there an unintended level of slow data ingestion or processing?
- Volume: How much data is in the table?
- Is the volume of data increasing or decreasing unintentionally?
- Quality: The quality of the data quality
- Are the possible values of the data within the expected range?
- For tables with a primary key, is the uniqueness of the records ensured?
- Schema: Schema of the data
- Can the data be kept up to date when the data structure changes?
- Lineage:
- A statement of the dependencies of data sources and tables
- If there is a problem with the data in a table, knowing the dependencies of that data allows us to quickly identify the scope of the issue
What we actually did to improve Data Observability
To increase Data Observability, we need to be able to monitor data from the five perspectives mentioned above. We identified that the current data infrastructure at fluct lacks Observability from the perspectives of freshness, volume, and quality. Therefore, we developed a concrete approach to enhance Observability in these areas. For the other two perspectives, we decided not to focus heavily on them as we could already identify and notice issues to some extent under the current setup.
Regarding the schema, there is a layer in the dbt model that extracts necessary values from the raw logs and assigns them types and column names. If a destructive change occurs in the schema of the raw logs, the processing in this layer should fail, alerting us to the issue. Therefore, we believe we are currently capable of detecting any problems that may arise. Additionally, for lineage, since the dbt execution environment is on dbt Cloud and the lineage of the dbt model can be viewed on the dbt Cloud console, we concluded that this setup is sufficient for our initial needs.
Adding dbt tests
dbt allows you to write tests for both dbt models and sources (refer to the official documentation on dbt tests). Previously, fluct's data infrastructure only utilized Singular tests to check the logic of accepted values and the processing for some models. However, there was still room for improvement by incorporating additional tests. Specifically, we decided to add the following tests:
Source freshness test
In dbt, you can define a table as a source before processing (refer to the official documentation on sources). At fluct, there are two types of tables that can be defined as sources:
- Tables that contain raw logs loaded from S3 or data from other companies without any processing.
- Tables loaded from the business system's DB to be used as dimension tables.
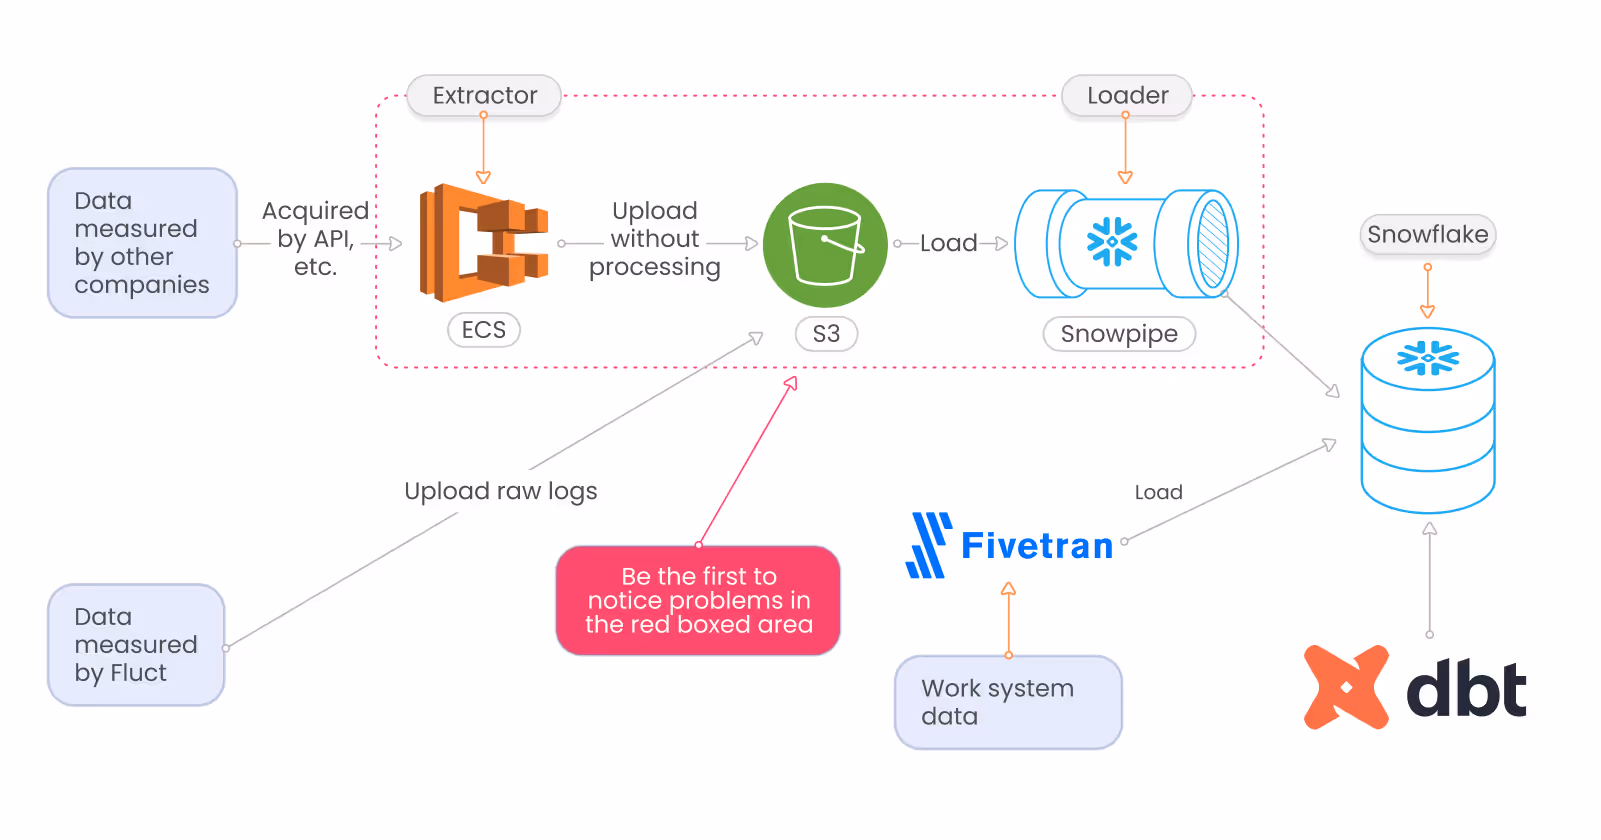
We added the source freshness test to the first group of tables, which contain the results of advertisement delivery. Any delay in loading these tables means that ad serving reports to users are also delayed. This is a problem we want to solve as soon as possible.
One of the main reasons for implementing the source freshness test is that if the test fails, we can assume there is an issue with log measurement, the Extractor batch, or Snowpipe. This allows us to quickly determine whether the problem lies in the dbt processing part or in a prior step. This capability was a significant motivation for me.
Not Null test
Next, we added a not null test for columns. Given the vast number of models where the not null test could be applied, we limited it to the layer where we extract necessary columns from the source or minimally rename them. Additionally, we decided to add the not null test only to models in this layer where the absence of a column would cause issues in subsequent processing or aggregation.
Elementary OSS + Elementary Cloud Implementation
We use a dbt package called Elementary (https://www.elementary-data.com) and a SaaS tool called Elementary Cloud to monitor dbt model execution status, freshness, volume anomaly detection, lineage, and more, all in one place.
Elementary is a dbt-native tool, with an OSS dbt package that makes it easy to add dbt tests and enhance Data Observability. Elementary Cloud offers a hosted environment for dashboards that display test results and lineages, along with alerts and automatic anomaly detection.
There are other SaaS Data Observability tools available, but we chose Elementary Cloud for several reasons:
- Competitive pricing
- Easy integration with dbt
- Availability of knowledge-sharing examples from in-house implementations
- The automated anomaly detection feature
For me, the automated anomaly detection feature was a significant factor in choosing Elementary Cloud.
While it is possible to write anomaly tests in the OSS version, it requires setting many parameters. Manually adding anomaly tests to each model is impractical, so having the ability to perform anomaly tests without configuring settings was very beneficial.

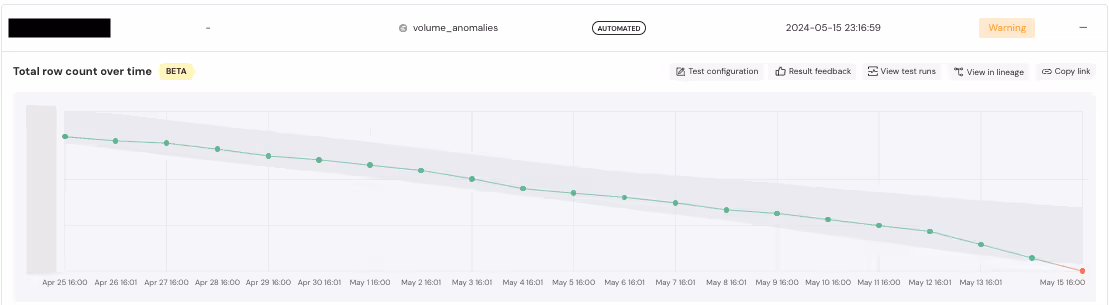
The dashboard screen allows you to view the status of dbt model and test execution, freshness, volume, and other critical information. For example, the following image shows the details of a model that triggered a warning in an automated volume test, including the volume trend.
There is also a screen where you can view the lineage of dbt models. This screen allows you to see the dependencies between models and trace lineage at the column level. Additionally, you can view the results of tests run on the model, providing a comprehensive understanding of your data's flow and integrity.
Future Outlook
By adding dbt tests and introducing the dbt package and SaaS tools provided by Elementary, we took the first step toward enhancing Data Observability for fluct. Currently, we can perform essential quality checks such as freshness, volume, and not null tests, and we can list lineages. This allows us to notice data problems more quickly and identify the causes more easily than before. However, there is still room for improvement in observability. We need to implement schema change detection and expand our quality tests beyond just not null checks. Since we have not yet encountered any data issues since implementing Elementary, we are still evaluating its effectiveness in operation.


