What are dbt artifacts?
dbt (data build tool) is a powerful transformation tool that enables data analysts and engineers to transform data in their warehouse. One of the key features of dbt is its ability to generate artifacts. But what exactly are dbt artifacts?
Definition: dbt artifacts are JSON files generated by dbt commands that store metadata about your dbt project. These artifacts include information about the project's resources, configurations, and execution details. They are essentially the byproducts of running dbt commands and provide a wealth of information that can be leveraged for various purposes.
Types of dbt artifacts:
- manifest.json: Contains comprehensive information about the dbt project, including models, tests, macros, and their relationships.
- run_results.json: Stores the results of a dbt invocation, including model timing, test results, and the number of captured records by dbt snapshots.
- catalog.json: Generated by the
dbt docs generatecommand, contains information from the data warehouse about views and tables, including column types and row counts. - sources.json: Produced by the
dbt source freshnesscommand, contains information about the freshness of data sources. - semantic_manifest.json: Used by MetricFlow to build metrics for the dbt Semantic Layer.
Why artifacts are useful?
dbt artifacts are useful for several reasons:
- Data Observability: Artifacts provide insights into model runtimes, failed tests, and source freshness. This information is crucial for monitoring the health and performance of your data pipelines.
- Documentation: Artifacts like
manifest.jsonandcatalog.jsonhelp generate comprehensive documentation for your dbt project. This documentation can be used to understand the structure and dependencies of your data models. - Debugging and Troubleshooting: The detailed logs and metadata stored in artifacts can be invaluable for debugging issues in your dbt project. For example,
run_results.jsoncan help you identify which models or tests failed and why. - Analytics on Analytics: By analyzing the artifacts, you can gain insights into the performance and efficiency of your dbt project. This can help you optimize your data transformations and improve overall project performance.
- Compliance and Auditing: Artifacts provide a detailed record of what transformations were run, when they were run, and what the results were.
When are artifacts produced?
Artifacts are produced whenever you run dbt commands. Different commands generate different artifacts:
- dbt run: Generates
manifest.json,run_results.json, and updatessources.json. - dbt test: Updates
run_results.jsonwith the results of the tests. - dbt docs generate: Generates
catalog.jsonand updates manifest.json. - dbt source freshness: Generates
sources.json - dbt parse: Generates
semantic_manifest.json
Each time you run these commands, the artifacts are updated to reflect the latest state of your project.
Where are artifacts produced?
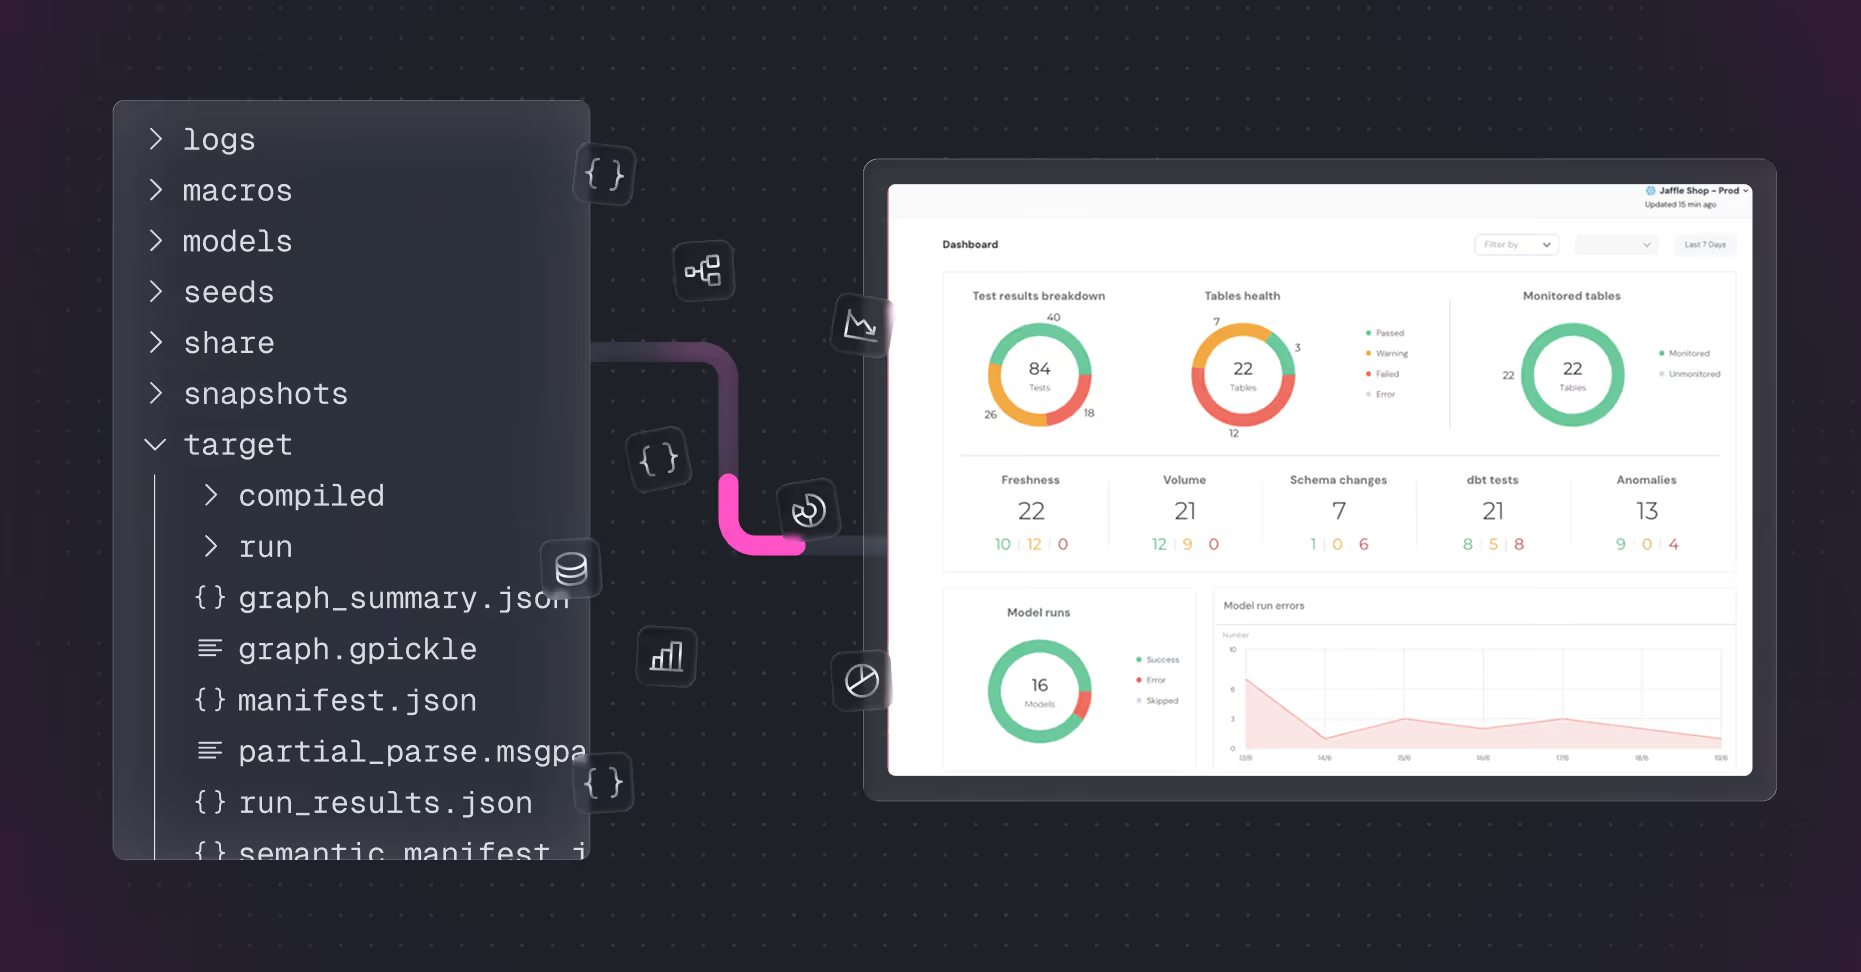
By default, dbt artifacts are stored in the /target directory of your dbt project. This directory is created automatically when you run dbt commands, and it contains all the generated artifacts.
The /target directory is typically structured as follows:
/target
  ├── manifest.json
  ├── run_results.json
  ├── catalog.json
  ├── sources.json
  ├── semantic_manifest.json
Artifacts in dbt Core vs. dbt Cloud
dbt Core: dbt Core is the open-source version of dbt that you can run locally or on your own infrastructure. In dbt Core, artifacts are generated and stored in the /target directory as described above. You have full control over these artifacts and can use them as you see fit.
dbt Cloud: dbt Cloud is the managed version of dbt that provides additional features like a web-based IDE, job scheduling, and more. In dbt Cloud, artifacts are still generated, but they are also integrated into the dbt Cloud interface. This means you can view and analyze artifacts directly within the dbt Cloud platform. Additionally, it provides features like automated documentation and data lineage visualization, which leverage the information stored in artifacts.
How to store artifacts?
Managing dbt artifacts is crucial for ensuring data observability, documentation, and debugging. Depending on your setup, there are different strategies to store and access these artifacts. In this section, we will explore three approaches.
1) Storing dbt artifacts for dbt Core + Airflow
For dbt Core users who run their dbt commands as tasks in Airflow on Kubernetes, managing dbt artifacts can be challenging. Since tasks are executed in ephemeral pods, the /target directory and its artifacts are deleted once the task is completed. To preserve these artifacts, you can send them to a persistent storage solution like Amazon S3 or Google Cloud Storage (GCS) as the final step of each dbt command run task.
To ensure that the artifacts are uploaded to S3/GCS immediately after the dbt command completes, you can perform the upload within the same Airflow task that runs the dbt command. This approach avoids the need for shared volumes and ensures that the artifacts are preserved even after the ephemeral pod is terminated.
Here’s how you can do it using the BashOperator in an Airflow DAG:
from airflow import DAG
from airflow.operators.bash_operator import BashOperator
from airflow.utils.dates import days_ago

# Define your DAG
dag = DAG(
    'dbt_run_and_upload_artifacts',
    default_args={
        'owner': 'airflow',
        'start_date': days_ago(1),
    },
    schedule_interval='@daily',
)

# Task to run dbt command and upload artifacts to S3
run_dbt_and_upload_to_s3 = BashOperator(
    task_id='run_dbt_and_upload_to_s3',
    bash_command="""
    dbt run --profiles-dir /path/to/profiles &&
    aws s3 cp /path/to/dbt/project/target/ s3://your-bucket/dbt-artifacts/{{ dag.dag_id }}/{{ task.task_id }}/{{ run_id }}/{{ ds }}/ --recursive
    """,
    dag=dag,
)

# Task to run dbt command and upload artifacts to GCS
run_dbt_and_upload_to_gcs = BashOperator(
    task_id='run_dbt_and_upload_to_gcs',
    bash_command="""
    dbt run --profiles-dir /path/to/profiles &&
    gsutil -m cp -r /path/to/dbt/project/target/* gs://your-bucket/dbt-artifacts/{{ dag.dag_id }}/{{ task.task_id }}/{{ run_id }}/{{ ds }}/
    """,
    dag=dag,
)

# Define task dependencies
run_dbt_and_upload_to_s3 >> run_dbt_and_upload_to_gcs
2) Accessing artifacts via dbt Cloud API
dbt Cloud offers APIs that allow you to programmatically access the content of the artifacts. This can be particularly useful for integrating dbt Cloud with other tools or for automating workflows. Here’s how you can access dbt artifacts using the dbt Cloud API:
- Retrieve Run Artifact API:
- Endpoint:
/accounts/{account_id}/runs/{run_id}/artifacts/{path} - Description: This API endpoint allows you to retrieve a specific artifact generated by a dbt run. You need to provide the account ID, run ID, and the path to the artifact you want to retrieve.
- Example:
- Endpoint:
curl -X GET \
  'https://cloud.getdbt.com/api/v2/accounts/{account_id}/runs/{run_id}/artifacts/{path}' \
  -H 'Authorization: Token YOUR_API_TOKEN'
- Response: The API will return the content of the specified artifact, such as
manifest.jsonorrun_results.json.
- Discovery API:
- Overview: The Discovery API allows you to query comprehensive information about your dbt Cloud project, including metadata about models, sources, and their execution results.
- Use Cases: You can use the Discovery API for data monitoring and alerting, lineage exploration, and automated reporting. This can help improve data discovery, data quality, and pipeline operations.
- Endpoints:
- Environment Level: Query the latest state and historical run results of a dbt Cloud project in production.
- Job Level: Retrieve results for a specific dbt Cloud job run for a given resource type, like models or tests.
- Example:
curl -X GET \
  'https://cloud.getdbt.com/api/v2/accounts/{account_id}/environments/{environment_id}/state' \
  -H 'Authorization: Token YOUR_API_TOKEN'
- Response: The API will return metadata about the project’s models, sources, and other nodes along with their execution results.
The DIY approach gives you full control over how and where the artifacts are stored, but it requires much more effort to set up and maintain.
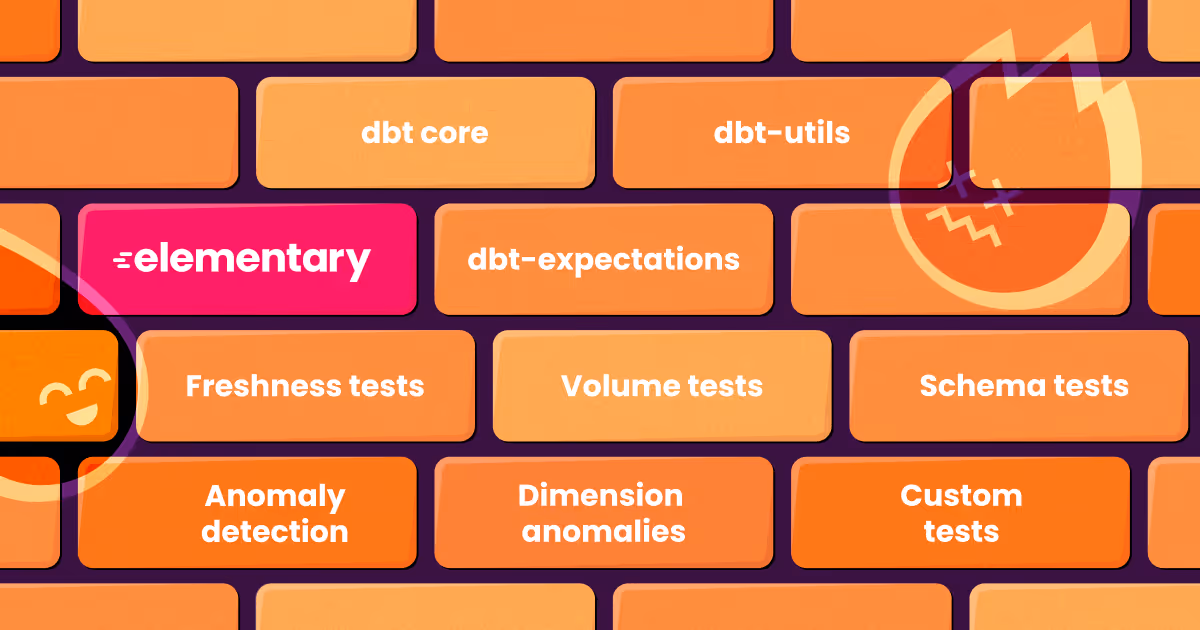
3) Using Elementary to automatically load artifacts into your warehouse
Elementary is a dbt-native data observability platform that simplifies the process of managing dbt artifacts. The Elementary dbt package includes macros that automatically extract the relevant data from artifacts and load them into tables in your data warehouse. This makes it easy to store and analyze dbt artifacts without having to build and maintain your own ETL pipelines.
Just add Elementary to your dbt packages.yml file:
packages:
  - package: elementary-data/elementary
    version: 0.15.1
    ## Docs: https://docs.elementary-data.com
Define the schema where the dbt artifacts will be loaded in your dbt_project.yml file:
models:
  ## see docs: https://docs.elementary-data.com/
  elementary:
    ## elementary models will be created in the schema '<your_schema>_elementary'
    +schema: "elementary"
    ## To disable elementary for dev, uncomment this:
    # enabled: "{{ target.name in ['prod','analytics'] }}"
Finally, import the package and select elementary models in the next run.
dbt deps
dbt run --select elementary
After the elementary dbt package has been installed and configured, your test results, run results, and dbt artifacts will be loaded to elementary schema tables. Seeing data in these models confirms the completion of the package deployment. Learn more in our docs.

Use Elementary to make the most of artifacts
Elementary provides several features that help you make the most of your dbt artifacts:
- Data Observability Dashboard: Elementary provides a data observability dashboard that visualizes the information stored in dbt artifacts. This dashboard includes metrics like model runtimes, test results, and source freshness, helping you monitor the health and performance of your data pipelines.
- Automated Alerts & Data Quality Monitoring: Use the
elementary_test_resultsanddbt_run_resultsartifacts to monitor the quality of your data. Set up alerts for failed tests of unexpected changes in model runtimes. - End-to-end Lineage: Elementary provides end-to-end data lineage visualization, leveraging the relationships stored in
manifest.json. This helps you understand how data flows through your dbt project and identify dependencies between models. - Performance Optimization: Analyze the
dbt_run_resultsartifact to identify long-running models and optimize their performance. Use the data observability dashboard to track improvements over time.
Learn more about Elementary Cloud or book a demo to see it live. You can also sign up for Elementary Cloud and start a free trial.
Conclusion
dbt artifacts are a powerful feature that provides valuable insights into your dbt project. They are generated whenever you run dbt commands and are stored in the /target directory. These artifacts are useful for data observability, documentation, debugging, analytics and compliance.
While you can manage and store dbt artifacts yourself, using a tool like Elementary can simplify the process and provide additional features like automated alerts, data observability dashboards, and end-to-end lineage visualization. By leveraging dbt artifacts and tools like Elementary, you can improve the performance, reliability, and transparency of your data pipelines.

.svg)


